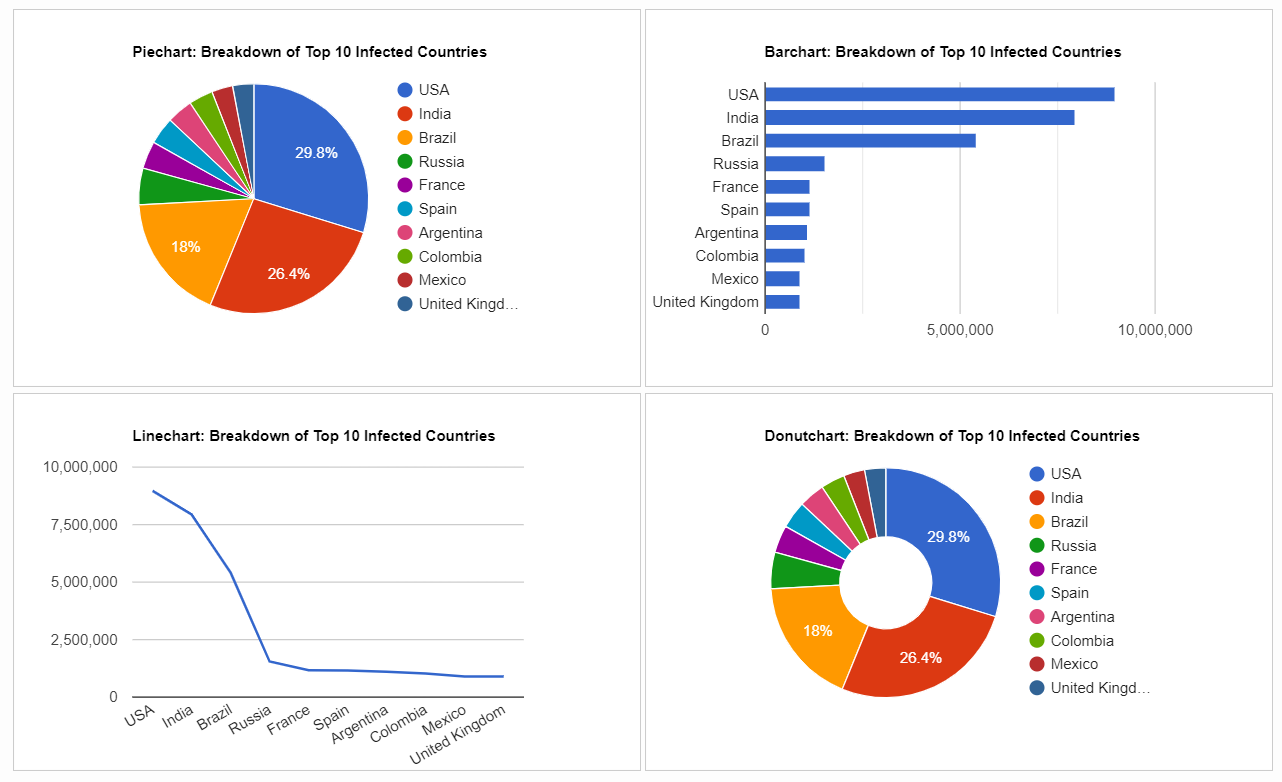
For example, suppose you want to draw multiple charts (Pie, Bar, Line and Donut), showing top 10 covid-19 infected countries as on today. The following example shows how to display both charts side-by-side.
If you want to draw multiple charts for the same data, it may be more convenient to write a single callback for both charts.

Fig 1: Pie, Bar, Line & Donut Charts
Step 1: Create required objects (table, sequence, trigger) and populate sample data into a table. (As per your requirements)
Step 2: Create a new blank page.
Drawing Multiple Charts using Single Callback:
Copy and paste below PLSQL code into the region's PLSQL code source.
-- setup bar chart options
DECLARE
l_title VARCHAR2(240) := 'Breakdown of Top 10 Infected Countries';
l_chart_values VARCHAR2(4000);
CURSOR cur_top10_countries IS
SELECT country, total_cases
FROM (SELECT COUNTRY, TOTAL_CASES,
RANK() OVER (ORDER BY total_cases DESC) AS rank
FROM fxgn_global_data)
WHERE rank <= 10;
BEGIN
htp.p('<html>');
htp.p('<head>');
htp.p('<script type="text/javascript"
src="https://www.gstatic.com/charts/loader.js"></script>');
htp.p('<script type="text/javascript">');
-- Load Charts and the corechart and barchart packages.
htp.p('google.charts.load(''current'', {''packages'':[''corechart'']})');
-- Draw the pie chart and bar chart when Charts is loaded.
htp.p('google.charts.setOnLoadCallback(drawChart)');
-- Construct chart values
FOR i IN cur_top10_countries
LOOP
l_chart_values := l_chart_values || '['''||i.country||''','||i.total_cases||'],';
END LOOP;
l_chart_values := substr(l_chart_values,1, length(l_chart_values)-1);
--dbms_output.put_line (l_chart_values);
-- draw chart
htp.p('function drawChart() {
var data = new google.visualization.DataTable();
data.addColumn(''string'', ''Country'');
data.addColumn(''number'', ''Total Cases'');
data.addRows(['||l_chart_values||'
])');
-- setup pie chart options
htp.p('var piechart_options = {title:''Piechart: '||l_title||''',
width:500,
height:300}');
htp.p('var piechart = new google.visualization.PieChart
(document.getElementById(''piechart_div''))');
htp.p('piechart.draw(data, piechart_options)');
htp.p('var barchart_options = {title:''Barchart: '||l_title||''',
width:500,
height:300,
legend: ''none''}');
htp.p('var barchart = new google.visualization.BarChart
(document.getElementById(''barchart_div''))');
htp.p('barchart.draw(data, barchart_options)');
-- setup line chart options
htp.p('var linechart_options = {title:''Linechart: '||l_title||''',
width:500,
height:300,
legend: ''none''}');
htp.p('var linechart = new google.visualization.LineChart
(document.getElementById(''linechart_div''))');
htp.p('linechart.draw(data, linechart_options)');
-- setup donut chart options
htp.p('var donutchart_options = {title:''Donutchart: '||l_title||''',
width:500,
height:300,
pieHole: 0.4}');
htp.p('var donutchart = new google.visualization.PieChart
(document.getElementById(''donutchart_div''))');
htp.p('donutchart.draw(data, donutchart_options)');
htp.p('}');
htp.p('</script>');
htp.p('</head>');
htp.p('<body>');
--Table and divs that hold the pie, bar, line, donut charts
htp.p('<table class="columns">');
htp.p('<tr>');
htp.p('<td><div id="piechart_div" style="border: 1px solid #ccc"></div></td>');
htp.p('<td><div id="barchart_div" style="border: 1px solid #ccc"></div></td>');
htp.p('<tr>');
htp.p('<tr>');
htp.p('<td><div id="linechart_div" style="border: 1px solid #ccc"></div></td>');
htp.p('<td><div id="donutchart_div" style="border: 1px solid #ccc"></div></td>');
htp.p('</tr>');
htp.p('</table>');
END;

Output: Then your output would then display like this,

The demo is here.
References:
Thanks for this helpful article, Are there way like this to draw waterfall-chart like google waterfall-chart?
ReplyDeletethanks in advance
Please share API
ReplyDelete6169C
ReplyDeleteglucotrust
https://www.pinshop.com.tr/game/pubg-mobile/pubg-mobile-uc