
Step 1: Create required objects (table, sequence, trigger) and populate sample data into a table. (As per your requirements)
Step 2: Create a new blank page.
Making a 2D Pie Chart:
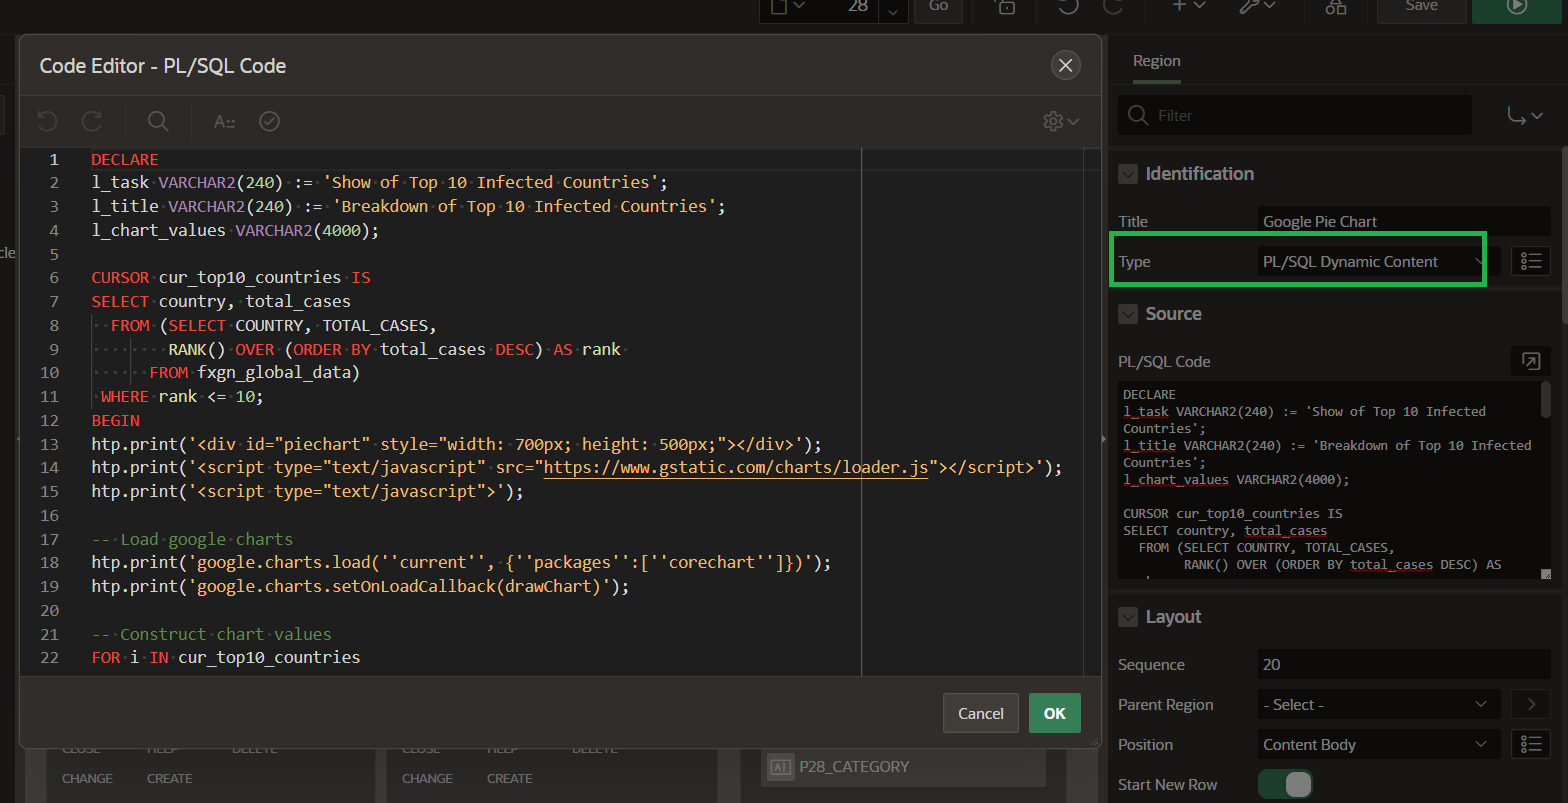
Copy and paste below PLSQL code into the region's PLSQL code source.
DECLARE
l_task VARCHAR2(240) := 'List out Top 10 Infected Countries';
l_title VARCHAR2(240) := 'Breakdown of Top 10 Infected Countries - 2D';
l_chart_values VARCHAR2(4000);
-- Getting Top 10 infected countries details
CURSOR cur_top10_countries IS
SELECT country, total_cases
FROM (SELECT COUNTRY, TOTAL_CASES,
RANK() OVER (ORDER BY total_cases DESC) AS rank
FROM fxgn_global_data)
WHERE rank <= 10;
BEGIN
htp.print('<div id="piechart" style="width: 700px; height: 500px;"></div>');
htp.print('<script type="text/javascript"
src="https://www.gstatic.com/charts/loader.js"></script>');
htp.print('<script type="text/javascript">');
-- Load google charts
htp.print('google.charts.load(''current'', {''packages'':[''corechart'']})');
htp.print('google.charts.setOnLoadCallback(drawChart)');
-- Construct chart values
FOR i IN cur_top10_countries
LOOP
l_chart_values := l_chart_values || '['''||i.country||''','||i.total_cases||'],';
END LOOP;
l_chart_values := substr(l_chart_values,1, length(l_chart_values)-1);
--dbms_output.put_line (l_chart_values);
-- Draw the chart and set the chart values
htp.print('function drawChart() {
var data = google.visualization.arrayToDataTable([
[''Task'', '''||l_title||'''],
'||l_chart_values||'
])');
-- Optional; add a title and set the width and height of the chart
htp.print('var options = {''title'':'''||l_title||'''}');
-- Display the chart inside the <div> element with id="piechart"
htp.print('var chart = new google.visualization.PieChart
(document.getElementById(''piechart''))');
htp.print('chart.draw(data, options)');
htp.print('}');
htp.print('</script>');
END;
Output: Then your output would then display like this,
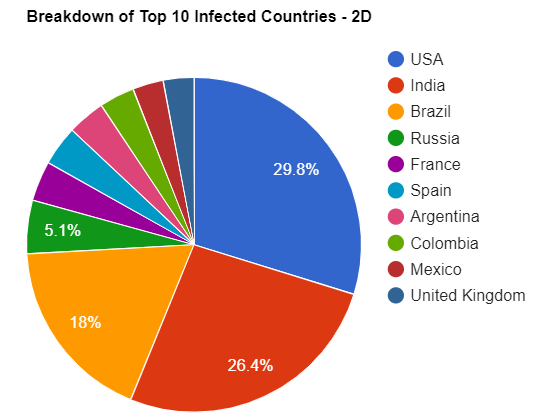
Making a 3D Pie Chart:
If you set the is3D option to true, your pie chart will be drawn as though it has three dimensions.
Copy and paste below PLSQL code into the region's PLSQL code source,
DECLARE
l_task VARCHAR2(240) := 'Show of Top 10 Infected Countries';
l_title VARCHAR2(240) := 'Breakdown of Top 10 Infected Countries - 3D';
l_chart_values VARCHAR2(4000);
CURSOR cur_top10_countries IS
SELECT country, total_cases
FROM (SELECT COUNTRY, TOTAL_CASES,
RANK() OVER (ORDER BY total_cases DESC) AS rank
FROM fxgn_global_data)
WHERE rank <= 10;
BEGIN
htp.print('<div id="piechart_3d" style="width: 700px; height: 500px;"></div>');
htp.print('<script type="text/javascript"
src="https://www.gstatic.com/charts/loader.js"></script>');
htp.print('<script type="text/javascript">');
-- Load google charts
htp.print('google.charts.load(''current'', {''packages'':[''corechart'']})');
htp.print('google.charts.setOnLoadCallback(drawChart)');
-- Construct chart values
FOR i IN cur_top10_countries
LOOP
l_chart_values := l_chart_values || '['''||i.country||''','||i.total_cases||'],';
END LOOP;
l_chart_values := substr(l_chart_values,1, length(l_chart_values)-1);
--dbms_output.put_line (l_chart_values);
-- Draw the chart and set the chart values
htp.print('function drawChart() {
var data = google.visualization.arrayToDataTable([
[''Task'', '''||l_title||'''],
'||l_chart_values||'
])');
-- add a title and set 3D
htp.print('var options = {''title'':'''||l_title||''', is3D: true}');
-- Display the chart inside the <div> element with id="piechart"
htp.print('var chart = new google.visualization.PieChart
(document.getElementById(''piechart_3d''))');
htp.print('chart.draw(data, options)');
htp.print('}');
htp.print('</script>');
END;
Output: Then your output would then display like this,

Making a Donut Chart:
A donut chart is a pie chart with a hole in the center. You can create donut charts with the pieHole option.
Copy and paste below PLSQL code into the region's PLSQL code source,
DECLARE
l_task VARCHAR2(240) := 'List out Top 10 Infected Countries';
l_title VARCHAR2(240) := 'Breakdown of Top 10 Infected Countries - Donut';
l_chart_values VARCHAR2(4000);
CURSOR cur_top10_countries IS
SELECT country, total_cases
FROM (SELECT COUNTRY, TOTAL_CASES,
RANK() OVER (ORDER BY total_cases DESC) AS rank
FROM fxgn_global_data)
WHERE rank <= 10;
BEGIN
htp.print('<div id="donutchart" style="width: 700px; height: 500px;"></div>');
htp.print('<script type="text/javascript"
src="https://www.gstatic.com/charts/loader.js"></script>');
htp.print('<script type="text/javascript">');
-- Load google charts
htp.print('google.charts.load(''current'', {''packages'':[''corechart'']})');
htp.print('google.charts.setOnLoadCallback(drawChart)');
-- Construct chart values
FOR i IN cur_top10_countries
LOOP
l_chart_values := l_chart_values || '['''||i.country||''','||i.total_cases||'],';
END LOOP;
l_chart_values := substr(l_chart_values,1, length(l_chart_values)-1);
--dbms_output.put_line (l_chart_values);
-- Draw the chart and set the chart values
htp.print('function drawChart() {
var data = google.visualization.arrayToDataTable([
[''Task'', '''||l_title||'''],
'||l_chart_values||'
])');
-- add a title and set pieHole value
htp.print('var options = {''title'':'''||l_title||''', pieHole: 0.4}');
-- Display the chart inside the <div> element with id="piechart"
htp.print('var chart = new google.visualization.PieChart
(document.getElementById(''donutchart''))');
htp.print('chart.draw(data, options)');
htp.print('}');
htp.print('</script>');
END;
Note: The pieHole option should be set to a number between 0 and 1, corresponding to the ratio of radii between the hole and the chart. Numbers between 0.4 and 0.6 will look best on most charts. Values equal to or greater than 1 will be ignored, and a value of 0 will completely shut your piehole.
You can't combine the pieHole and is3D options; if you do, pieHole will be ignored.
Output: Then your output would then display like this,

The demo is here.
Try using JSON_OBJECT and JSON_ARRAY
ReplyDeleteSure, let me try, but somewhat i feel this approach is little better than the approach which you proposed.
DeleteThanks for the feedback Chuck. I have created a Plugin APEX Google Pie Chart (Using JSON_OBJECT and JSON_ARRAY). Please do try out (https://apex.world/ords/f?p=100:710:7633322251075::::P710_PLG_ID:ORCLKING.GOOGLE.PIECHART)
DeleteThis would be the most straightforward way to get this done. Thanks a lot for sharing brother.
ReplyDeleteThanks Deepak. Please try out APEX Google Pie Chart Plugin (https://apex.world/ords/f?p=100:710:7633322251075::::P710_PLG_ID:ORCLKING.GOOGLE.PIECHART)
DeleteHow can i change slice color ?
ReplyDelete